Getting Started In Forex - The Introduction
Learn how the market works and essential aspects of forex trading before you make your first trade.
What is Forex?
- 1.1 Foreign exchange (Forex/FX) market
- Foreign exchange trading is the exchange of one currency of a country with another. The foreign exchange market is formed by banks around the world quoting and dealing among them round the clock every day. It is now part of everyday lives among individuals and countries. The average daily trading volume of international foreign exchange markets is around US $ 4 trillion.
- 1.2 Major participants in FX markets
- The participants of foreign exchange markets include central banks, commercial banks, non-bank financial institutions, brokers, traders and large multinational enterprises. They perform frequent trades, with transactions in millions and tenth millions US dollars. Participants can also be classified as either investors or speculators based on their trading objectives.
- 1.3 World's largest foreign exchange centres
-
There are around 30 foreign exchange markets in the world, spreading throughout different countries and regions within all continents. Traditionally they are Asia-Pacific, Europe and North America regions. The major foreign exchange markets are London, Frankfurt, Zurich and Paris in Europe, New York and Los Angeles in North America and Sydney, Tokyo, Singapore and Hong Kong in Asia-Pacific.
London is the world's largest FX trading centre. As the eldest international financial centre, London has also the longest history in FX market. The market started its formation before the World War I. In October 1979, foreign exchange controls were completely lifted in London, FX market there was then under rapid development. With around 600 banks having their headquarters and branches in the city, London has a very active FX market.
Due to the unique geographical location of London which connecting the Asian and North American markets: London market opens when Asian markets closes, and it closes when New York market opens; trading is extremely active during this period, and this makes London the world's largest FX trading centre and it has significant impact to the FX market trend.
-
Tokyo Average daily trading volume is US$150 billion. Many investors watch this market to forecast the market trend of the day. One tenth of the foreign exchange trading is made in the Tokyo market. The trading volumes of Japanese Yen, New Zealand Dollar and Australian Dollar here are much larger than those of other currencies. London Average daily trading volume is US$570 billion. The London FX Market, being the most disciplined and influential FX market, generates about 30% of the market trading volume. Many major banks carry out FX trades in this market. New York Average daily trading volume is US$330 billion. It is the world's second largest FX market, generating about 16% of the market trading volume. Most trades are executed between 8:00a.m. and 12:00 noon New York time, which is the most active trading time for European investors. New York FX market is affected by US stock and bond market. - 1.4 Forex market hours
-
Open (HKT) Close (HKT) Asia Pacific Sydney 7:00 13:00 Tokyo 8:00 16:00 Hong Kong 10:00 16:00 Europe Frankfurt 14:30 21:30 London 15:00 0:00 North America New York 20:00 4:00 Los Angeles 21:00 5:00 Due to the different geographical locations and time zones among all financial centres in the world, the foreign exchange markets operate 24 hours non-stop daily, thus forming a colossal market. The foreign exchange markets in Wellington, Sydney, Tokyo, Hong Kong, Frankfurt, London, and New York, etc. are closely interlinked, providing investors with an investment platform without time and space limitation. FX markets are only closed on Saturdays, Sundays and at important national festivals of respective countries.
High volatility, no up or down-limit, transparency and low possibility of manipulation and insider trading make the FX market participants not limited to people with practical use, but also involve investors.
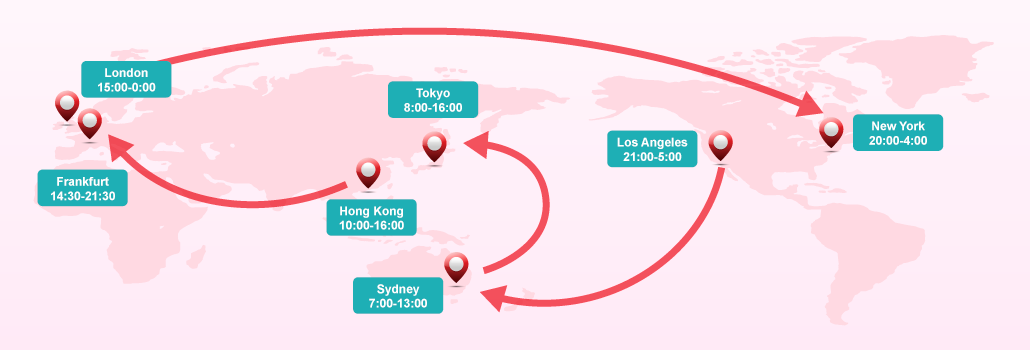
Notes: Above market hours are shown in Hong Kong time.
- 1.5 Currency abbreviations and trade practices
-
Currency Name Abbreviation US Dollar USD Euro EUR Japanese Yen JPY British Pound GBP Swiss Franc CHF Australian Dollar AUD New Zealand Dollar NZD Canadian Dollar CAD Hong Kong Dollar HKD Prices in forex trading are quoted in currency pairs. e.g. Euro versus US Dollar (EUR/USD), US Dollar versus Japanese Yen (USD/JPY), British Pound versus US Dollar (GBP/USD), etc. The first currency quoted in a currency pair is known as the “Base Currency”, whereas the second one is known as the “Quoted Currency”. A FX price represents how much of the quoted currency is required for exchanging one unit of base currency. For example, if you expect Euro, compared to US dollar, will appreciate, then you will buy EUR/USD, which means you are buying Euro (meanwhile selling US dollar). If you expect Euro will depreciate, then you will sell EUR/USD (which means selling Euro and buying US dollar).
- 1.6 Forex quotes
-
- Direct quotes
-
Also known as "Price Quotation in U.S. Terms".
Direct quotes are used on British Pound (GBP), Euro (EUR), Australian Dollar (AUD), New Zealand Dollar (NZD) forex trading.
It is quoted as the number of unit of US Dollar per unit of foreign currency.i.e. 1 British Pound = 1.3200 US Dollar, 1 Australian Dollar = 0.7000 US Dollar.
- Indirect quotes
-
Also known as "Volume Quotation in European Terms".
It is a foreign exchange rate quoted as the number of unit of foreign currency per unit of the domestic currency
i.e. 1 US Dollar = 0.9200 Swiss Franc, 1 US Dollar = 110.00 Japanese Yen
Forex Trading Fundamentals
- 2.1 Forex margin requirements in Hong Kong
- In forex trading, the margin requirement refers to a good faith deposit for possible trading loss on opened positions. The margin allows traders to participate in leveraged trade, and hold positions greater than the margin
deposit value. The Hong Kong margin level is 5% of the open position value, which is 1:20 leverage, the maximum allowed by the SFC regulations.
Learn more about margins. - 2.2 Spreads
-
Spread refers to the difference between the sell and buy price of a two-way price quote. In forex trading, the spread is the transaction cost for the investors. (Some brokers may apply charges on clients e.g. commission and service charges apart from spread).
In this example of EUR/USD, a quote of sell price 1.30596 versus buy price 1.30604, (1.30604 – 1.30596 = 0.8) 0.8 is the price spread. For every 1 lot (equivalent to 10,000 EUR) traded for EUR/USD, each pip change in value is worth 1 USD of profit or loss on your trading account.
Learn more about our spreads.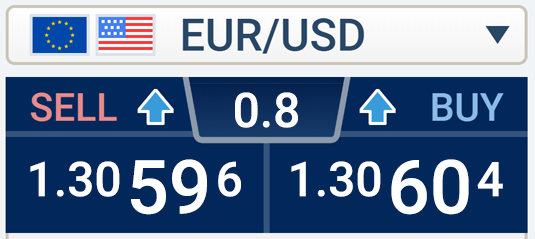
- 2.3 Rollover interest
-
If investor holds position more than one trading day, they may earn or pay the rollover interest rate, which is based on the interest rate difference between the currency pairs they are trading.
Learn more about our rollover policy. - 2.4 Physical delivery vs. leveraged trading
-
Physical Delivery Leveraged Trading Lot size 10,000 10,000 Open price 1.2850 1.2850 Funds required HKD 99,730 HKD 4,986.53 Pip cost USD 1 USD 1 If price goes up to 1.3350 Profit (in dollars) HKD 3,900 HKD 3,900 Rate of Return 3.91% 78.21%
Fundamental Analysis
- 3.1 Introduction to fundamental analysis
- Fundamental analysis refers to the study of financial market and economic studies in attempt to predict the trend and value of currency fluctuations. The studied materials may include economic figures, news, rates trends and governmental policies. Contrary to technical analysis, technical analysis focuses solely on market factors in currency market trends when evaluating the price trends. In study of macroeconomics, it generally includes domestic and international economic indicators, such as Gross Domestic Product (GDP), inflation rate, interest rates etc., which may involve too much data and figures. It could lead to incomplete and uncertainties in data collection. Furthermore, news release so frequently and it takes time to investigate and gather up information. By the time the results are ready, it may have already outdated and deviated. Thus, it is necessary to combine the use of fundamental analysis and technical analysis.
- 3.2 Interest rates
-
Interest rate is one the major factors that affects a country's currency, basically because it provides income for investors. It is logical for investors to hold a currency that brings in the highest possible interest. For example, if 1 year fixed deposit rate of Australian Dollar is 3.5% and 0.25% for the US Dollar, rational investors will tend to hold AUD and sell USD.
Furthermore, interest rate change anticipation also plays a major role in currency fluctuations. An appreciation of AUD could be expected when the interest rate spread between AUD and USD widens, and vice versa.
- 3.3 Economic indicators
-
- 3.3.1 Non-farm Payrolls (Importance: )
-
Non-farm payrolls represents the total number of paid U.S. workers of any business, excluding the following employees: general government employees, private household employees and employees of non-profit organizations. It generally occurs on the first Friday of the month.
Typically, non-farm payrolls indicates the conditions of the economy. When non-farm payrolls drops, it represents companies lower its production and resulting a downturn in the economy. If non-farm payrolls stimulates, a healthy economy is expected and in theory it benefits the currency. Therefore, non-farm payrolls is an important indicator that influences the economy and the development of the financial market.
- 3.3.2 Housing Starts and Building Permits (Importance: )
-
In US, "housing starts" separates into two kinds- single and group of houses. When single house is constructed, it is indexed to 1. For a group of house that contains 100 units, it is indexed to 100. Normally, experts place a higher weight on single house building because the units in group of house could be change in any time and leads to variability of the data. Housing starts and building permits have become relatively important nowadays in Western countries as it reflects the condition of the economy. Housing construction is recognized as an "investment". It helps to stimulate the economy since employment rate will increase when "Housing starts" increases.
Moreover, the construction of new houses has a chain effect on other industries such as manufacturing, raw materials, mortgage sector etc. and boosts the entire economy. In theory, a country’s currency benefits when housing starts and building permits increase. When they drop unexpectedly, there will be a pressure on one country’s currency.
- 3.3.3 New Home Sales (Importance: )
-
An economic indicator that measures sales of newly built homes. A new home sale is considered to be any deposit or contract signing either in the year the house was built or the year after it was built. This indicator is released by the U.S. Department of Commerce's Census Bureau at the end of the month.
In general, the purchase of new house often involves mortgage, hence new home sales is affected directly by the mortgage rate. New home sales play a major role in the retail sector. It reflects the condition of the real estate market. When the consumption is strong in real estate properties, it reveals the economy is in a good shape and theoretically benefits a country’s currency. Furthermore, new home sales are positively related to the housing starts and building permits. If housing starts and building permits lower, new home sales are expected to be decreased.
- 3.3.4 Producer Price Index (Importance: )
-
Producer Price Index known as PPI measures the average change in selling prices received by domestic producers of goods and services over time. It is viewed as an indication of the inflation level. PPIs measure price change from the perspective of the seller. The PPI looks at three areas of production: industry-based, commodity-based, and stage-of-processing-based companies. In US, PPI is measured by the US Bureau of Labor Statics. Most of the data is collected through survey from producers in manufacturing, mining, and service industries with around 2300 types of commodities, afterward, it is compared against the basic index year which is 1967.
In general, when a large and sustained and accelerated increase in the producer price index, the country's central bank reaction is to take the rate hike countermeasures to prevent the rapid rise in inflation, the increased possibility of the appreciation of the national currency.
- 3.3.5 Retail Sales (Importance: )
-
The retail sales report captures in-store sales as well as catalogue and other out-of-store sales. Retail sales report as a major indicator of the economy reflects the change of customers’ consumption level. In some developed Countries, retail sales become a big component of total gross domestic product (GDP). Higher retail sales may represent a better economy and results in higher interest rate, eventually benefits the value of the currency.
In US, generally a monthly economic indicator is compiled and released by the Census Bureau and the Department of Commerce in United States. The report covers the previous month, and is released about two weeks after the month-end. The report also breaks down sales figures into groups such as food and beverages, clothing, and autos. The results are often presented two ways: with and without auto sales being counted, because their high sticker price can add extra volatility to the data.
- 3.3.6 Index of Consumer Sentiment (Importance: )
-
Index of Consumer Sentiment is known as the level of consumer’s confidence that measures the optimistic level of consumers to the economy in the near future.
The report is conducted through random sampling that includes the comments of consumers view on current and expected economy condition, employment rate and personal financial position. By comparison to the University of Michigan Consumer Confidence Index, the fluctuation of Index of Consumer Sentiment is relatively larger which indeed lowers the reliability.
Overall, the fundamental idea is that if the consumers are optimistic and rational, they will tend to purchase more goods and services. This increase in spending will inevitably stimulate the whole economy and may lead to a higher interest rate and benefits the currency.
- 3.3.7 Durable Goods Orders (Importance: )
-
Durable goods orders is a monthly economic indicator released by the Bureau of Census that reflects on new orders placed with domestic manufacturers for delivery of factory hard goods (durable goods) in the near future and the level of manufacturing activity.
Overall, orders for factory hard goods can provide information on how busy factories will be in the future. Orders placed in current months may provide work in factories for many months to come as they work to fill the orders. Rising durable goods orders are normally associated with stronger economic activity and can therefore lead to higher short-term interest rates, which is usually supportive for a currency.
- 3.3.8 ISM Manufacturing Index (Importance: )
-
An index based on surveys of more than 300 manufacturing firms by the Institute of Supply Management. It monitors the employment level, production inventories, new orders and supplier deliveries and based on these surveys, a composite diffusion index is created to illustrate the conditions in national manufacturing in United States.
By monitoring the ISM Manufacturing Index, investors are able to better understand national economic conditions. When this index is increasing, investors can assume that the stock markets will go up because of higher corporate profits.
- 3.3.9 Jobless Claims (Importance: )
-
A measure of the number of jobless claims filed by individuals seeking to receive state jobless benefits. This number is watched closely by financial analysts because it provides insight into the direction of the economy. Higher initial claims correlate with a weakening economy.
The strength of a nation's economy will have an impact on the value of its currency. Therefore, forex traders typically look at the initial claims figure as part of their analyses when assessing a currency's prospects for the immediate future. Generally speaking, week-by-week numbers are too volatile to get an accurate picture of economic changes, so four-week moving averages are typically used for the initial claims metric.
- 3.3.10 Purchasing Manager Index (Importance: )
-
An indicator of the economic health of the manufacturing sector. The PMI index is based on five major indicators: new orders, inventory levels, production, supplier deliveries and the employment environment. A PMI of more than 50 represents expansion of the manufacturing sector, compared to the previous month. A reading under 50 represents a contraction, while a reading at 50 indicates no change. Prior to September 1, 2001, the acronym (PMI) stood for Purchasing Managers' Index. The Institute of Supply Management (ISM) now uses only the acronym, PMI. Although the ISM publishes several indexes, the PMI is the most widely followed and is sometimes referred to as the ISM index.
- 3.3.11 Unemployment Rate (Importance: )
-
The percentage of the total labour force that is unemployed but actively seeking employment and willing to work.
From 1948 to 2004, the monthly U.S. unemployment rate has ranged between about 2.5% to 10.8%, averaging approximately 5.6%. The unemployment rate is considered a lagging indicator, confirming but not foreshadowing long-term market trends. An unemployment rate equal or lower than 3.0% is considered "full employment" in U.S.
- 3.3.12 University of Michigan Consumer Sentiment Index (Importance: )
-
University of Michigan Consumer Sentiment Index is a regular survey conducted by the researchers of University of Michigan on consumers about the assessment of personal financial status and national economic status.
Researchers of University of Michigan use the raw survey data from 500-600 adults, and calculate the seasonal adjusted consumer confidence, current index and expected index. Researchers set the result of the first quarter of 1966 100 for the need of index calculation.
For a long time, the data is a valuable guideline for the change of consumer attitude, which can be used to predict consumer behaviour. In addition, compared with other data which serve similar purposes, this data has lower volatility and higher stability. There is close correlation between this index and consumer spending.
If this index rises, the bond market will be treated as bearish and bond price will fall; stock market will be treated as bullish. There is hint for the US dollar exchange rate from the Fed, if consumer confidence rise, consumption will grow, and economy will be stronger; then Fed will raise interest rates, and US dollar exchange rate will be stronger.
Technical Analysis
- 4.1 Introduction to technical analysis
-
The technical analysis is the study of financial markets in the past (the use of the chart) to predict the price trend and decided the use of investment strategies. In theory, technical analysis only considers the behaviour of the market or the real price of the financial instruments. By assumption, the premise to assume that its price will reflect all investors via other channels with all relevant factors studies.
The basic beliefs of the technical analysis are built on “History will repeat itself endlessly” and uses statistical datasets to predict the market moment. Technical analysis is widely used by traders and financial experts most of the time. Some researches state that the use of technical analysis is more extensive compared to fundamental analysis in the foreign exchange market.
- 4.2 Support line
-
Support Line is considered as the level at which a lot of buyers tend to enter the market. Often referred to as the "support level". In the uptrend, a trend line is drawn through the lowest swing-points of the price move. Connecting at least two "lowest lows" will create a trend line. A trend line confirms its validity when the price respects this line. The more "lowest lows" the trend line contains, the more reliable it is. When the price drops down to the support level, there may be a pressure that prevent it for further decrease. Therefore, by investigating the support level, an optimal buy-in price could be found.
- 4.3 Resistance line
-
In the uptrend, a trend lines is drawn through the highest swing-points of the price move. Connecting at least two "highest highs" will create a trend line. The more times that the price has tried unsuccessfully to break through the resistance level, the more formidable that area of resistance becomes. When the price increases up to the resistance level, there may be a pressure that prevent it for further increase. Generally, resistance level is viewed as a selling signal.
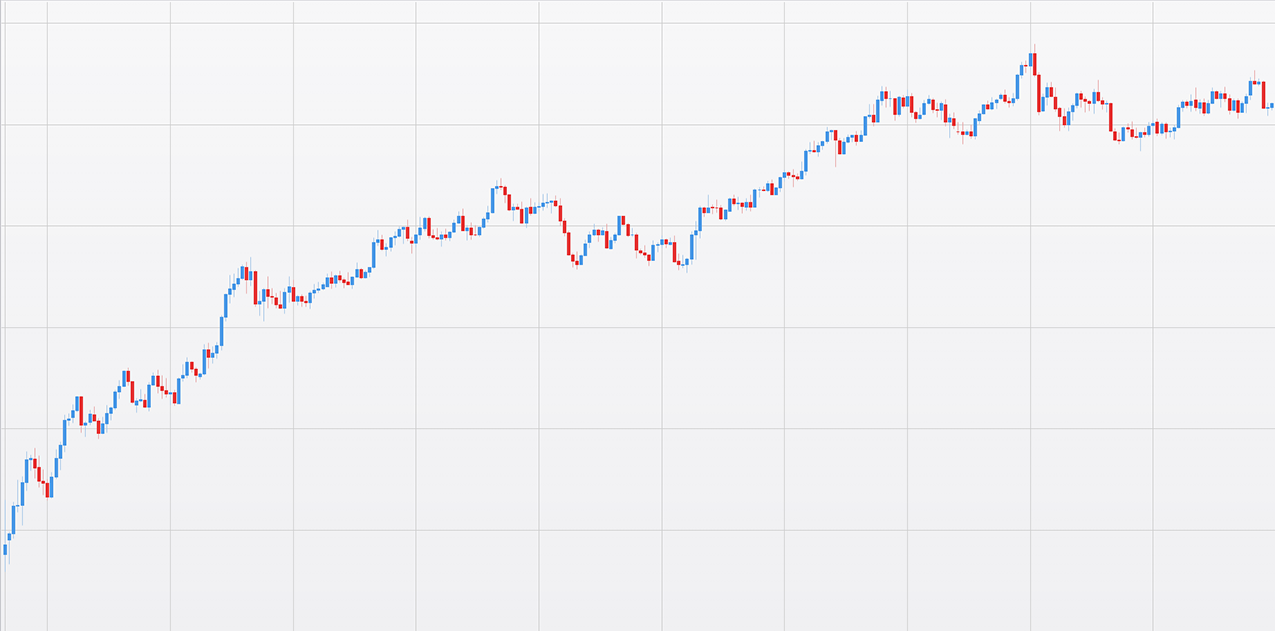
- 4.4 Uptrend
-
Describes the price movement of a financial asset when the overall direction is upward. A formal uptrend is when each successive peak and trough is higher than the ones found earlier in the trend. Notice how each successive peak and trough is located above the previous ones. There are buying signals at each trough. Plotting a trend line on a Forex chart gives very valuable information. Not only the trend line will show a current trend of the price move, it will also depict points of support and resistance levels for market price. In addition, it will also help to determine good entry and exit points, best positioning for profit taking and placing protective stops. This is very simple but relatively powerful tool that will be viewed as one of the crucial indicators of possible trend reversal.
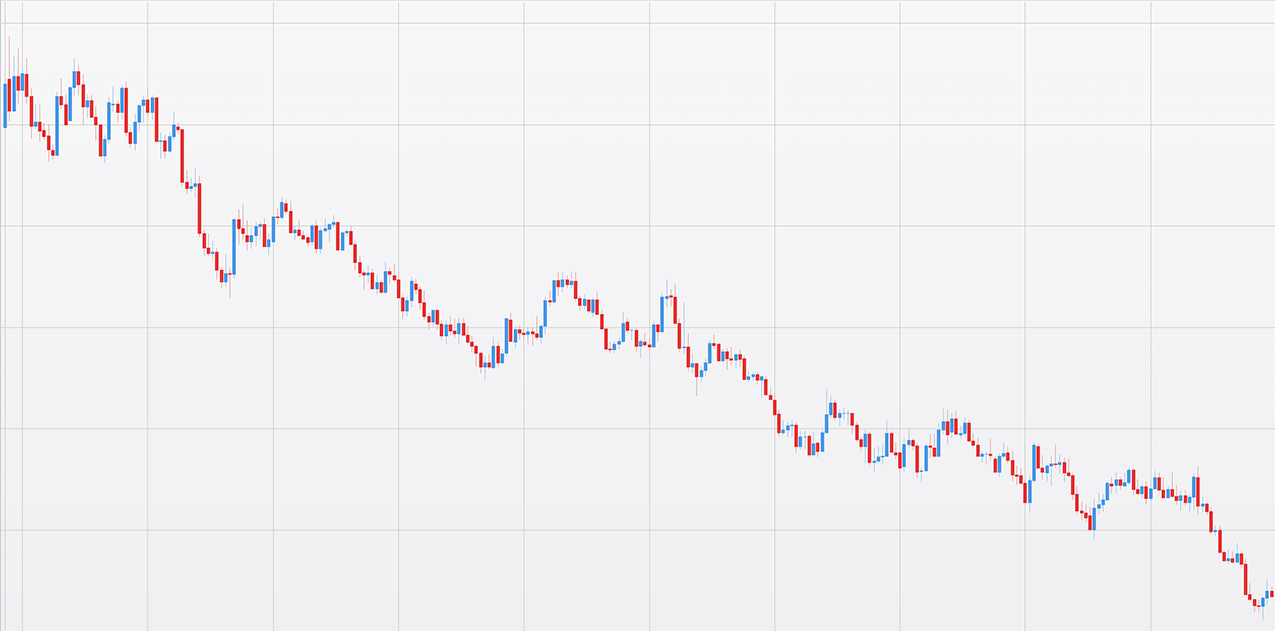
- 4.5 Downtrend
-
Describes the price movement of a financial asset when the overall direction is downward. A formal downtrend occurs when each successive peak and trough is lower than the ones found earlier in the trend. Notice how each successive peak and trough is lower than the previous one.